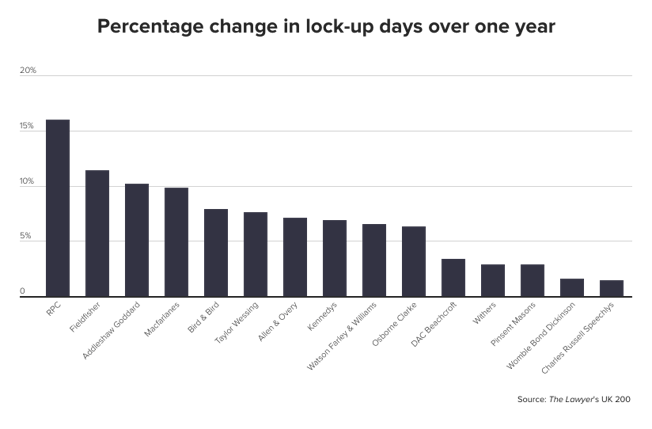
This summer has seen another round of big pay rises for newly qualified (NQ) solicitors, with several large City firms reaching the magic £100,000 number one way or another. Here’s the wider context.
Away from the big boys, there is no salary war – yet
The UK’s largest firms have a tough decision on their hands: to what extent should they try and keep pace with the magic circle in the blossoming junior lawyer pay wars that have seen newly qualified solicitor (NQ) salaries rocket? But elsewhere in the City, life continues much as normal.
Known pay rises in the mid-tier have been nothing out of the ordinary this year. Watson Farley & Williams has boosted NQ pay by 5 per cent from £70,000 to £73,700, while a 4 per cent rise at Lewis Silkin sees pay go from £60,000 to £62,500, and a 4.7 per cent uplift at Farrer & Co means their NQs are now paid £67,000.
| Firm | First year trainee 2018 | First year trainee 2019 | Second year trainee 2018 | Second year trainee 2019 | NQ 2018 | NQ 2019 | NQ % increase |
| Charles Russell Speechlys | £40,000 | £40,000 | £42,000 | £42,000 | £65,000 | £66,000 | 1.5 |
| Farrer & Co | £38,000 | £39,000 | £41,000 | £42,500 | £64,000 | £67,000 | 4.7 |
| Forsters | £40,000 | £41,000 | £42,000 | £43,000 | £62,000 | £64,000 | 3.2 |
| Harbottle & Lewis | £35,000 | £36,000 | £37,000 | £38,000 | £57,000 | £59,000 | 3.5 |
| HFW | £38,000 | £41,000 | £40,000 | £41,000 | £66,000 | £66,000 | 0.0 |
| Howard Kennedy | £36,500 | £36,500 | £38,500 | £38,500 | £58,500 | £60,000 | 2.6 |
| Kingsley Napley | £34,000 | £34,000 | £36,000 | £36,000 | £58,000 | £59,000 | 1.7 |
| Lewis Silkin | £37,250 | £38,000 | £41,500 | £42,500 | £60,000 | £62,500 | 4.2 |
| RPC (London) | £38,000 | £38,000 | £41,000 | £41,000 | £64,800 | £66,500 | 2.6 |
| Stephenson Harwood | £41,000 | £43,000 | £45,000 | £47,000 | £73,000 | £75,000 | 2.7 |
| Watson Farley & Williams | £43,000 | £43,000 | £46,000 | £46,000 | £70,000 | £73,700 | 5.3 |
The gap between the big firms and the mid-tier is wider than ever before
It seems strange to think that, not really very long ago, virtually all firms paid their NQs the same. Examination of The Lawyer’s archives would tell you that 20 years ago, in 1999, junior lawyer pay at Clifford Chance was £32,000 per year, the same as, for example, a typical example of a much smaller city firm, Farrer & Co.
The following year Clifford Chance opened up a £6,000 gap. Since then the gulf has widened and narrowed but as recently as six years ago, in 2013, the difference in base salary between Clifford Chance and Farrers was less than £5,000.
Farrers has pulled a £3,000 pay rise out of the bag for 2019 and now pays NQs £67,000. Meanwhile, Clifford Chance no longer reveals its base salary, preferring instead to report its total possible compensation package, but based on the pay of close competitors it is likely to be in the region of £90,000. That means the gap between CC and Farrers is now something like £23,000.
Similarly, firms like Taylor Wessing, which closely matched magic circle salaries for a decade between 2003 and 2013, have now fallen noticeably behind. These firms have a choice to make. They can join the war, keep raising salaries. From a purely financial perspective, they can afford it. A £13,000 pay rise for every single one of Taylor Wessing’s 20-odd NQs would only amount to around £260,000.
Alternatively, firms in the TW mould can refuse to play the game and instead sell themselves as offering a better all-round experience for junior lawyers. There are definite merits to that strategy – but equally, when you like to think of yourself as a top international firm, there are dangers to pitching yourself as a lifestyle choice.
| Year | Clifford Chance NQ salary | Farrer & Co NQ salary | Gap |
| 1999 | £33,500 | £33,500 | £0 |
| 2000 | £42,000 | £36,000 | £6,000 |
| 2001 | £50,000 | £37,000 | £13,000 |
| 2002 | £50,000 | £37,000 | £13,000 |
| 2003 | £48,000 | £40,000 | £8,000 |
| 2004 | £50,000 | £43,000 | £7,000 |
| 2005 | £50,000 | £43,000 | £7,000 |
| 2006 | £55,000 | £44,000 | £11,000 |
| 2007 | £63,500 | £47,000 | £16,500 |
| 2008 | £66,600 | £51,000 | £15,600 |
| 2009 | £59,000 | £48,000 | £11,000 |
| 2010 | £61,500 | £53,000 | £8,500 |
| 2011 | £61,500 | £55,000 | £6,500 |
| 2012 | £61,500 | £55,000 | £6,500 |
| 2013 | £61,500 | £57,000 | £4,500 |
| 2014 | £63,500 | £58,500 | £5,000 |
| 2015 | £70,000 | £59,000 | £11,000 |
| 2016 | £85,000 (total compensation) | £59,000 | c.£13,000* |
| 2017 | £87,300 (total compensation) | £60,000 | c.£18,000* |
| 2018 | £91,000 (total compensation) | £64,000 | c. £14,000* |
| 2019 | £100,000 (total compensation) | £67,000 | c. £23,000* |
*Clifford Chance’s base salary estimated based on Hogan Lovells’ figures, which has closely matched the magic circle historically

It’s never been harder to compare like-for-like
On that note, there has been a trend among the magic circle firms in the last few years to record “average compensation,” compensation with some bonuses included and maximum possible packages. That way of doing things has now spread to some, but not all, firms, making like-for-like comparison very difficult.
Furthermore, until a few years ago, it was perfectly commonplace for firms to announce salaries up to 3PQE. That practice has also ceased.
The salary gap between the market-topping US firms and the magic circle is the smallest in 20 years… sort of
It may seem that the £143,000 paid by the likes of Akin Gump to London NQs means the top US firms are pulling further and further away from the rest of the market. In one sense (the sense that NQs care about) that’s true. The gap between the top-paying US firm and Freshfields Bruckhaus Deringer in 1999 was £13,000, in 2009 it was £31,000 and in 2019 it’s £43,000.
But the percentage gap is the smallest it has been since 1999. Back then, the top-paying US firm’s NQs were paid 41 per cent more than at Freshfields. They are now paid 43 per cent more, the smallest percentage difference since then.

| Year | Top-paying firm | Top of market | NQ salary at Freshfields | Gap | Percentage difference |
| 1998 | White & Case | £45,000 | £30,000 | £15,000 | 50% |
| 1999 | White & Case | £45,000 | £32,000 | £13,000 | 41% |
| 2000 | White & Case | £55,000 | £32,000 | £23,000 | 72% |
| 2001 | Cleary Gottlieb | £59,500 | £33,000 | £26,500 | 80% |
| 2002 | Sidley Austin | £75,520 | £50,000 | £25,520 | 51% |
| 2003 | Sidley Austin | £75,520 | £50,000 | £25,520 | 51% |
| 2004 | Sidley Austin | £75,520 | £50,000 | £25,520 | 51% |
| 2005 | Sidley Austin | £75,520 | £50,000 | £25,520 | 51% |
| 2006 | Sidley Austin | £75,520 | £52,000 | £23,520 | 45% |
| 2007 | Latham & Watkins | £88,000 | £55,000 | £33,000 | 60% |
| 2008 | Latham & Watkins | £96,000 | £65,000 | £31,000 | 48% |
| 2009 | Latham & Watkins | £96,970 | £66,000 | £30,970 | 47% |
| 2010 | Bingham McCutchen | £100,000 | £59,000 | £41,000 | 69% |
| 2011 | Bingham McCutchen | £100,000 | £60,000 | £40,000 | 67% |
| 2012 | Bingham McCutchen | £100,000 | £61,500 | £38,500 | 63% |
| 2013 | Bingham McCutchen | £100,000 | £65,000 | £35,000 | 54% |
| 2014 | Bingham McCutchen | £100,000 | £65,000 | £35,000 | 54% |
| 2015 | Akin Gump | £100,000 | £67,500 | £32,500 | 48% |
| 2016 | Milbank & ors | £124,000 | £67,500 | £56,500 | 84% |
| 2017 | Milbank & ors | £124,000 | £85,000 | £39,000 | 46% |
| 2018 | Akin Gump & ors | £143,000 | £85,000 | £58,000 | 68% |
| 2019 | Akin Gump & ors | £143,000 | £100,000 | £43,000 | 43% |
The pay war doesn’t extend to trainees
While NQ salaries are skyrocketing, trainee pay is not. There are probably a number of reasons for this, a limit to what clients are willing to put up with being one of them. But the main reason is likely to be that the NQ pay wars in London have been largely driven by first-year associate salaries in New York. With no trainee equivalent in the United States, there is no benchmark to keep up with, and no great incentive for even the top-paying US firms to push the boat out when it comes to trainee salaries.
Take Hogan Lovells, a typical member of the City elite. Its starting salary for a trainee is 122 per cent higher than it was 20 years ago – but its NQ salary has risen 195 per cent. The pay hike you get on qualification at the firm has increased from £8,000 to £39,000 in that time.

Hogan Lovells salaries over time
| Year | First year trainee salary | Second year trainee salary | NQ base salary | Pay jump: trainee to NQ | Percentage increase: trainee to NQ |
| 1998 | £20,750 | £22,500 | £30,500 | £8,000 | +35% |
| 2003 | £28,000 | £32,000 | £50,000 | £18,000 | +56% |
| 2008 | £37,000 | £42,000 | £65,000 | £23,000 | +55% |
| 2013 | £39,000 | £44,000 | £63,000 | £19,000 | +49% |
| 2018 | £45,000 | £50,000 | £78,000 | £28,000 | +56% |
| 2019 | £46,000 | £51,000 | £90,000 | £39,000 | +76% |
| 20-year increase | £25,250 (+122%) | £28,500 (+126%) | £59,500 (+195%) |


